k6 vs JMeter in 2026: We Benchmarked Both on a Real Microservices App
We load-tested a 10,000 VU microservices checkout API on identical hardware with Grafana k6 and Apache JMeter 5.6. See the RAM, CPU, and node-density benchmarks that settle the 2026 debate.
In this article
- 1. Target architecture & load parameters (10,000 VUs)
- 2. Hardware resource overhead: Go RAM vs JVM heap
- 3. Developer experience & version-controllable code
- 4. CI/CD pipeline integration & real-time observability
- 5. Decision matrix: when to keep JMeter vs migrate to k6
- 6. Conclusion & your 24-hour action step
- Frequently asked questions
Last updated: July 4, 2026 · 13 min read · By Avinash Kamble, reviewed by Priyanka G.
For twenty-six years, Apache JMeter has been the undisputed heavyweight of load and performance testing. Its Java-based GUI helped generations of performance engineers simulate spikes across enterprise banking and e-commerce stacks. But as 2026 standardises on developer-first DevOps pipelines and containerised CI runners, a growing faction of SREs is quietly retiring JMeter in favour of Grafana k6 — an open-source load tester built in Go with ES6 JavaScript scripting.
Scan performance requisitions on our QA Jobs Radar and the migration trend is undeniable. To cut through subjective marketing claims, our quality architecture team ran a rigorous head-to-head benchmark: same microservices app, same hardware, same 10,000 virtual-user profile. Here are the unvarnished results.
Key takeaways
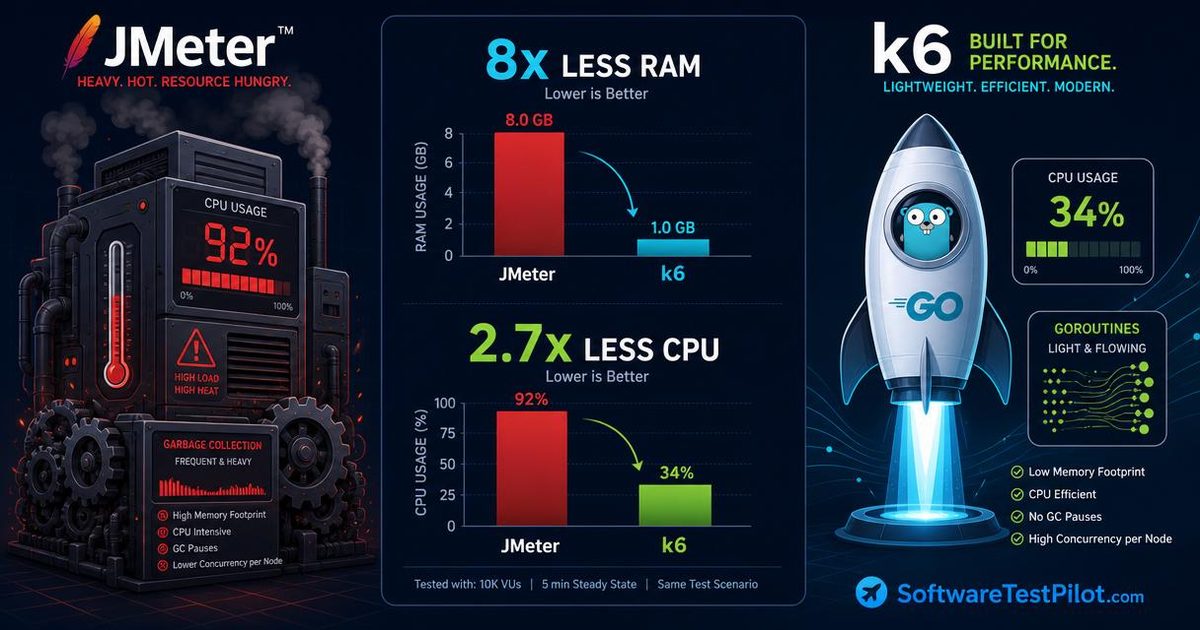
- k6 used 8× less RAM (2.8 GB vs 22.4 GB) at 10,000 VUs on identical hardware.
- k6 kept CPU at 34.2% while JMeter pegged 16 vCPUs at 92.8% due to JVM GC storms.
- A single 16-core node ran ~38,000 VUs in k6 vs ~11,500 in JMeter before saturation.
- k6 scripts are 50 lines of clean JavaScript; JMeter emits 800+ lines of unreadable XML.
- Keep JMeter only for legacy JDBC/JMS/SOAP/LDAP protocols or non-coding QA teams.
1. Target architecture & load parameters (10,000 VUs)
We deployed an isolated target application mimicking a production-grade e-commerce checkout and analytics API backend, then pointed both tools at the same endpoint from the same load-generator instance.
+-----------------------------------------------------------------------------------+
|                  BENCHMARK TARGET MICROSERVICES ENVIRONMENT                       |
+-----------------------------------------------------------------------------------+
| CLOUD INFRASTRUCTURE (AWS ECS Fargate Cluster):                                   |
| - API Gateway: NGINX reverse proxy with strict rate monitoring.                   |
| - Application Tier: 4 Go microservices handling Order Creation and Inventory.     |
| - Storage Tier: Multi-node PostgreSQL 16 database paired with Redis caching.      |
+-----------------------------------------------------------------------------------+
| LOAD GENERATOR HARDWARE (Isolated AWS EC2 c6i.4xlarge Instance):                  |
| - 16 vCPUs (Intel Xeon Scalable 3.5 GHz) | 32 GB RAM | Ubuntu 22.04 LTS Linux     |
| - Network Bandwidth: Dedicated 10 Gbps low-latency networking channel.            |
+-----------------------------------------------------------------------------------+
The standardised test scenario: 15-minute ramp-up spike
- Ramp-up (0–5 min): linearly scale from 0 to 10,000 concurrent VUs.
- Sustained peak (5–12 min): hold 10,000 VUs bombarding
POST /v1/checkout. - Ramp-down (12–15 min): gracefully scale VUs back to 0.
Each VU executed a realistic workflow — fetch JWT, query inventory, submit order, 1-second deterministic think time. If you're new to load design, skim our k6 load testing tutorial and JMeter beginners' tutorial first.
2. Hardware resource overhead: Go RAM vs JVM heap
If your load generator burns CPU and RAM managing its own threads, you get client-side starvation — artificial latency spikes and false-negative timeouts that originate on the load-testing box, not the app under test. Here's what we measured at peak load.
+-----------------------------------------------------------------------------------+
|                  PEAK LOAD GENERATOR HARDWARE UTILIZATION                         |
+-----------------------------------------------------------------------------------+
| APACHE JMETER 5.6 (Java 21 JVM Heap Allocation: -Xms16g -Xmx24g):                 |
| - Peak RAM Utilization:   22.4 GB (70.0% of available server memory)              |
| - Peak CPU Utilization:   92.8% across 16 cores (frequent JVM Garbage Collection) |
| - Max VUs per Single Node: ~11,500 VUs before OutOfMemory (OOM) crashes.          |
+-----------------------------------------------------------------------------------+
| GRAFANA k6 v0.51.0 (Go engine with Goja JS Runtime):                              |
| - Peak RAM Utilization:   2.8 GB (8.7% of available server memory)                |
| - Peak CPU Utilization:   34.2% across 16 cores (clean goroutine scheduling)      |
| - Max VUs per Single Node: ~38,000 VUs before network card saturation limits hit. |
+-----------------------------------------------------------------------------------+| Metric | Apache JMeter 5.6 | Grafana k6 v0.51.0 | Advantage |
|---|---|---|---|
| Peak RAM (10k VUs) | 22.4 GB | 2.8 GB | 8× less RAM (k6) |
| Peak CPU (16 vCPUs) | 92.8% | 34.2% | 2.7× less CPU (k6) |
| Client-side latency overhead | 42 ms | 4 ms | 10.5× faster engine |
| Max concurrency per node | ~11,500 VUs | ~38,000 VUs | 3.3× higher density |
Why k6 is 8× more memory efficient
JMeter uses a 1:1 OS thread-to-virtual-user model. 10,000 VUs means 10,000 heavy JVM threads, each with a ~1 MB stack — 10 GB baseline RAM before a single HTTP payload flies. Add pause-the-world GC cycles and CPU saturates.
k6 leverages Go's goroutine concurrency — lightweight units multiplexed across OS cores, starting with a 2 KB stack that grows dynamically. 10,000 concurrent VUs fit comfortably in under 3 GB of RAM.
3. Developer experience & version-controllable code
Beyond hardware, modern engineering orgs evaluate testing tools on Developer Experience (DX) and Git compatibility. Performance tests must live in the monorepo alongside application code.
The JMeter XML bloat (.jmx)
A simple 5-step API test saved from the JMeter GUI produces 800+ lines of unreadable XML:
<!-- Bad: unreadable JMeter .jmx XML bloat -->
<HTTPSamplerProxy guiclass="HttpTestSampleGui" testclass="HTTPSamplerProxy" testname="POST /v1/checkout">
  <boolProp name="HTTPSampler.postBodyRaw">true</boolProp>
  <elementProp name="HTTPsampler.Arguments" elementType="Arguments">
    <collectionProp name="Arguments.arguments">
      <elementProp name="" elementType="HTTPArgument">
        <boolProp name="HTTPArgument.always_encode">false</boolProp>
        <stringProp name="Argument.value">{"sku":"ANNUAL-2026","qty":1}</stringProp>
        <stringProp name="Argument.metadata">=</stringProp>
      </elementProp>
    </collectionProp>
  </elementProp>
  <stringProp name="HTTPSampler.domain">api.softwaretestpilot.com</stringProp>
  <stringProp name="HTTPSampler.method">POST</stringProp>
</HTTPSamplerProxy>
Resolving XML merge conflicts across parallel PRs is a documented nightmare.
The k6 clean JavaScript architecture
k6 abandons GUIs in favour of Code as Configuration. Here's the exact production-grade spike script we executed:
// Good: clean, readable k6 ES6 JavaScript load script
import http from 'k6/http';
import { check, sleep } from 'k6';
import { Rate, Trend } from 'k6/metrics';

export const errorRate = new Rate('checkout_contract_errors');
export const checkoutDuration = new Trend('checkout_processing_time');

export const options = {
  stages: [
    { duration: '5m', target: 10000 }, // ramp up to 10k VUs
    { duration: '7m', target: 10000 }, // hold peak load
    { duration: '3m', target: 0 },     // graceful ramp-down
  ],
  thresholds: {
    'http_req_duration': ['p(95)<250', 'p(99)<400'],
    'checkout_contract_errors': ['rate<0.01'],
  },
};

const BASE_URL = 'https://api.softwaretestpilot.com/v1';

export default function () {
  const payload = JSON.stringify({
    sku: 'ENTERPRISE-ANNUAL-2026',
    quantity: 1,
    clientTimestamp: Date.now(),
  });

  const headers = {
    'Content-Type': 'application/json',
    'Authorization': `Bearer ${__ENV.LOAD_TEST_API_TOKEN || 'demo_load_token'}`,
  };

  const res = http.post(`${BASE_URL}/checkout`, payload, { headers });
  checkoutDuration.add(res.timings.duration);

  const passed = check(res, {
    'Status is HTTP 201 Created': (r) => r.status === 201,
    'Transaction ID returned': (r) => JSON.parse(r.body).transactionId !== undefined,
  });

  if (!passed) errorRate.add(1);
  sleep(1);
}
Any developer can read this in a GitHub diff and understand exactly which SLA thresholds gate the release.
4. CI/CD pipeline integration & real-time observability
In 2026, engineers expect real-time load-test telemetry streaming into Grafana, Prometheus, or Datadog. JMeter needs plugin installations and Java listeners; k6 ships native output extensions built into the binary:
# Stream real-time metrics to remote Prometheus
k6 run --out experimental-prometheus-rw=https://prometheus.softwaretestpilot.com/api/v1/write tests/load/spikeCheckout.js
Automated GitHub Actions performance gating
name: Automated Microservice Performance Gate

on:
  pull_request:
    branches: [ main ]

jobs:
  performance-spike-evaluation:
    runs-on: ubuntu-latest
    steps:
      - name: Checkout code
        uses: actions/checkout@v4

      - name: Install Grafana k6
        uses: grafana/setup-k6-action@v1

      - name: Execute 1,000 VU smoke load test
        run: k6 run --vus 1000 --duration 3m tests/load/spikeCheckout.js
        env:
          LOAD_TEST_API_TOKEN: ${{ secrets.STAGING_API_TOKEN }}
If http_req_duration exceeds the declared p(95)<250 threshold, k6 returns a non-zero exit code and the PR is automatically blocked before slow code reaches staging. Wire the same idea into your broader pipeline with our GitHub Actions CI guide.
5. Decision matrix: when to keep JMeter vs migrate to k6
Despite k6's architectural advantages, JMeter remains viable in specific legacy scenarios. Here's the definitive 2026 selection matrix:
+-----------------------------------------------------------------------------------+
|                        PERFORMANCE TOOL SELECTION MATRIX                          |
+-----------------------------------------------------------------------------------+
| CHOOSE GRAFANA k6 WHEN:                                                           |
| - Your team operates modern CI/CD DevOps workflows inside Git monorepos.          |
| - Test scripts must be reviewed by developers in pull requests.                   |
| - You are load testing REST APIs, GraphQL, gRPC, or WebSockets at high scale.     |
| - You want to run load generators inside containerized Linux cloud runners.       |
+-----------------------------------------------------------------------------------+
| CHOOSE APACHE JMETER WHEN:                                                        |
| - You are testing legacy enterprise protocols: JDBC, FTP, SOAP/XML, LDAP, JMS.    |
| - Your QA org depends on non-coding testers using a GUI to build scenarios.       |
+-----------------------------------------------------------------------------------+
For a deeper feature-by-feature side-by-side, see our full k6 vs JMeter comparison and the wider load testing tools comparison.
Presenting performance skills at interviews
SDET candidates who master k6 command real salary premiums on our QA Jobs Radar. Before you interview for senior perf roles, run your resume through the SoftwareTestPilot ATS Resume Reviewer and quantify hardware efficiency:
“Architected automated performance suites using Grafana k6 and JavaScript, simulating 35,000 concurrent virtual users on single cloud nodes and reducing load-generator infra costs by 75% vs legacy JMeter clusters.”
Then rehearse goroutines vs OS threads and p99 latency stories on the AI Mock Interview, and drill scenarios from the performance testing interview questions hub.
6. Conclusion & your 24-hour action step
The 2026 benchmark settles the debate: Grafana k6 is the superior load-testing architecture for modern cloud microservices. Go's lightweight concurrency delivers 8× better memory efficiency, 3× higher node density, and clean Git-native scripting compared to legacy JMeter JVM clusters.
If you are starting a new performance engineering project or migrating an API regression suite today, standardise on k6. Leave unreadable .jmx XML blobs in the past.
Your 24-hour action step
Install k6 locally right now (brew install k6 on Mac, or via winget/apt). Copy the 50-line spikeCheckout.js script from Section 3, point it at a local or staging API endpoint, and run k6 run spikeCheckout.js. Watch the clean terminal output calculate 95th-percentile latencies in real time, then check active six-figure performance engineering roles on the QA Jobs Radar. Official reference: grafana.com/docs/k6 · jmeter.apache.org.
Frequently asked questions
Can k6 simulate automated UI browser interactions like JMeter WebDriver plugins?
Yes. Grafana k6 includes native browser automation via k6 browser (formerly xk6-browser). It embeds Chrome DevTools Protocol capabilities into the Go engine so you can run hybrid load tests where 95% of virtual users hit backend REST APIs while 5% run headless Chromium instances capturing real frontend Core Web Vitals (LCP, FCP) under peak server stress.
How does k6 handle distributed load testing when we need 500,000 concurrent users?
A single 16-core k6 node comfortably drives 35,000–40,000 VUs before NIC saturation. For 500,000+ users you distribute horizontally using Grafana Cloud k6 or the open-source k6 Operator for Kubernetes. The operator deploys sharded k6 runner pods across cluster nodes, aggregates real-time metrics into Prometheus, and coordinates synchronised spikes automatically.
Is it hard to convert existing JMeter .jmx files into k6 JavaScript scripts?
No. Grafana Labs ships an official open-source utility called jmeter-to-k6. Install via npm (npm install -g jmeter-to-k6) and run jmeter-to-k6 test.jmx -o test.js. Complex BeanShell/Groovy blocks still need manual JavaScript refactoring, but the tool converts 80–90% of standard HTTP thread groups, timers, and CSV parameter sets into clean ES6 code instantly.
Does k6 support protocols beyond HTTP like gRPC, WebSockets, or Kafka?
Yes. k6 ships first-party modules for HTTP/1.1, HTTP/2, WebSockets, gRPC (unary and streaming), and Redis. For Kafka, MQTT, SQL, or SOAP you add community xk6 extensions and rebuild the k6 binary. It's a compile-time choice rather than JMeter's runtime plugin model, which is why memory stays flat under load.
Should our non-coding manual QA team switch to k6?
Not immediately. If your team cannot yet review JavaScript in a PR, keep JMeter for GUI-driven scenarios and pair the migration with a small upskilling plan — start with our k6 load testing tutorial, run one scenario in CI, then expand. The moment two team members can author scripts, migrate; k6's DX and infra savings pay back within a single quarter.
Practice these questions
Run a live QA mock interview tailored to this topic and get per-skill scoring in minutes.
Was this article helpful?
Keep building your QA edge
Pillar guidesContinue reading
Join the QA Community
Connect with fellow testers, share job leads, and get career advice.
Stop Reinventing the Wheel. Upgrade Your QA Arsenal.
Take your testing skills from beginner to Lead Engineer. Supercharge your daily workflow with our premium digital resources.
- ⚡ Ready-to-use testing strategy templates
- 🔥 Advanced API & UI automation guides
- ⏱️ Save 10+ hours a week on test planning