JMeter Performance Testing: Step by Step (2026 Beginner Guide)
Learn JMeter step by step in 2026. A beginner's guide to JMeter performance testing covering installation, test plans, thread groups, samplers, listeners, assertions, recording, correlation, and CI/CD.

In this article
- 1. What Is JMeter and Why It Still Matters in 2026
- 2. Install JMeter Step by Step
- 3. JMeter Core Concepts
- 4. Your First Test Plan
- 5. Thread Group Deep Dive
- 6. Samplers, the Workhorses
- 7. Listeners for Reports
- 8. Assertions and Timers
- 9. Recording with the HTTP(S) Test Script Recorder
- 10. Correlation and Parameterization
- 11. Logic Controllers
- 12. HTML Dashboard Reporting
- 13. Distributed Load Testing
- 14. JMeter in CI/CD
- 15. JMeter Best Practices for 2026
- 16. Choosing the Right Hardware for Load Testing
- 17. Common JMeter Errors and How to Fix Them
- Continue your performance testing journey
- Frequently asked questions
Last updated: June 22, 2026 · Reading time: 22 minutes · By SoftwareTestPilot Editorial Team
What you'll build: By the end of this JMeter tutorial for beginners you will have a working JMeter 5.6.3 install, a Thread Group simulating 50 concurrent users hitting a real API, three listeners reporting response time and throughput, an HTML dashboard you can share with stakeholders, and the same plan running in CI on every pull request.
1. What Is JMeter and Why It Still Matters in 2026
Apache JMeter is a 100% pure Java open-source desktop application designed to load-test functional behavior and measure performance. Originally built for web apps, it has grown into a multi-protocol load engine that supports HTTP, HTTPS, SOAP, REST, FTP, LDAP, JDBC, JMS, MQTT, SMTP, POP3, IMAP, and TCP. In 2026 it remains the most widely deployed open-source load testing tool on the planet, with active monthly releases from the Apache Software Foundation.
JMeter is not a browser — it does not execute JavaScript or render pixels. It is a protocol-level load generator. That makes it perfect for API load testing, web server load testing, database load testing, and message queue load testing. For full browser-level load, use k6 Browser or Playwright on a grid.
2. Install JMeter Step by Step
Prerequisites
- Java 17 or 21 LTS — download from Adoptium. JMeter 5.6.3 requires Java 8+; Java 17 or 21 is recommended in 2026.
- 8 GB RAM minimum — 16 GB if you plan to run heavy distributed tests.
Step 1 — Download JMeter
Get the latest binary from jmeter.apache.org. Pick the apache-jmeter-5.6.3.zip (or .tgz) — not the source.
Step 2 — Extract
unzip apache-jmeter-5.6.3.zip -d ~/tools/Step 3 — Set JAVA_HOME
# macOS / Linux
export JAVA_HOME=$(/usr/libexec/java_home)
export PATH=$JAVA_HOME/bin:$PATH
java -version
Step 4 — Launch the GUI
cd ~/tools/apache-jmeter-5.6.3/bin
./jmeter.sh            # macOS / Linux
jmeter.bat             # Windows
Pro tip: For serious work, run JMeter in CLI (non-GUI) mode. The GUI is for building and debugging only — it cannot generate realistic load because of its own overhead.
3. JMeter Core Concepts
| Concept | What it does |
|---|---|
| Test Plan | The root container for everything in JMeter |
| Thread Group | Simulates a group of users. Set number of threads, ramp-up, loop count |
| Sampler | Sends a request to the server (HTTP, JDBC, FTP, etc.) |
| Listener | Collects and displays results (View Results Tree, Summary Report) |
| Assertion | Verifies a response matches expectations (status code, body, time) |
| Timer | Introduces realistic think-time between requests |
| Controller | Defines the order of samplers (Loop, Transaction, If, While, ForEach) |
| Config Element | Default values reused by samplers (HTTP Header, CSV Data Set, User-Defined Variables) |
| Pre/Post Processor | Runs before/after a sampler (extract dynamic values, save data) |
Execution order inside a Thread Group: Config Elements → Pre-Processors → Timers → Sampler → Post-Processors → Assertions → Listeners. Knowing this order is the key to debugging mysterious JMeter behaviour.
4. Your First Test Plan
We will build a test that simulates 50 users hitting a public API and check that 95% of responses arrive within 500 ms.
Step 1 — Add a Thread Group
Right-click Test Plan → Add → Threads (Users) → Thread Group. Configure:
- Number of Threads (users): 50
- Ramp-Up Period (seconds): 10
- Loop Count: 20
Step 2 — Add an HTTP Request Sampler
- Protocol:
https - Server Name or IP:
jsonplaceholder.typicode.com - HTTP Request:
GET - Path:
/users/1
Step 3 — Add a Duration Assertion
Right-click the HTTP Request → Add → Assertions → Duration Assertion. Set 2000 ms.
Step 4 — Add a Response Assertion
Add → Assertions → Response Assertion. Field to Test: Response Code, Pattern: 200.
Step 5 — Add a Summary Report listener
Right-click Thread Group → Add → Listener → Summary Report.
Step 6 — Run it
Click the green Run button (or Ctrl+R). Watch the Summary Report fill up with samples, average, median, 90% line, 95% line, throughput, error %.
Step 7 — Save and run in CLI
jmeter -n -t first-plan.jmx -l result.jtl -e -o report/The report/ directory now contains an interactive HTML dashboard. Open report/index.html in a browser.
5. Thread Group Deep Dive
The Thread Group defines the load shape. JMeter 5.6 ships three flavors:
| Type | When to use |
|---|---|
| Thread Group | Static load: fixed number of users, ramp-up, loop count |
| setUp Thread Group | Warm-up before the main load (login flows, cache priming) |
| tearDown Thread Group | Cleanup after the main load (reset state, dump metrics) |
| Ultimate Thread Group (plugin) | Spike/stair-step load shapes — essential for capacity tests |
| Concurrency Thread Group (plugin) | Targets a constant throughput or concurrent users, no ramp-up cliff |
| Open Model Thread Group (plugin) | Schedules load by arrival rate (Poisson, uniform) |
Ramp-up math
Ramp-up of 10 seconds with 50 users adds a new user every 0.2 seconds. Pick a ramp long enough that the system can absorb the load gradually — a 1-second ramp with 1000 users will look like a spike test, not a load test.
Loop count vs duration
Loop count is deterministic and great for CI. Duration-based testing (with the Scheduler checkbox) is better for soak tests because it survives a slow server.
6. Samplers, the Workhorses
HTTP Request
The most-used sampler. Supports GET, POST, PUT, PATCH, DELETE, files, headers, body, query parameters, follow redirects, and parallel downloads. Use Retrieve All Embedded Resources only for HTML page tests — it can multiply your load by 10×.
JDBC Request
Hit a database directly. Add a JDBC Connection Configuration Config Element with the JDBC URL, driver class, and credentials. Use parameterized SQL with ${variable} substitution. Wrap each query in a Transaction Controller to measure end-to-end timing.
JMS / MQTT / Kafka samplers
For message-queue load testing, JMeter has dedicated samplers (or plugins for Kafka). Configure the broker, topic, payload, and QoS.
FTP / SMTP / TCP samplers
For legacy or integration testing — JMeter still ships these because protocol-level load is its core competency.
7. Listeners for Reports
Listeners consume memory and CPU. Use them only during development; in CI write the JTL log file and generate the HTML report from it.
| Listener | Use case |
|---|---|
| View Results Tree | Debugging individual requests — request and response bodies |
| Summary Report | One-line per sampler — aggregate stats |
| Aggregate Report | Same as Summary + extra percentiles (90%, 95%, 99%) |
| Aggregate Graph | Bar chart of throughput over time |
| Response Time Graph | Line chart of response time over time |
| Backend Listener | Streams metrics to InfluxDB, Graphite, or Prometheus |
| Simple Data Writer | Writes JTL only — lowest overhead |
Anti-pattern: Adding View Results Tree to a heavy load test will skew your results and may OOM the load generator. Use it only on a single thread while debugging.
8. Assertions and Timers
Duration Assertion
Fails any response slower than the configured threshold. Use it to enforce SLAs.
Response Assertion
Validate status code, headers, body content, or response size. Patterns can be Contains, Matches (regex), Equals, or Substring.
JSON Assertion
Validate JSON Path expressions against the response. Use $.user.id to assert a user object has an ID field.
Timers
By default JMeter fires requests with zero think-time, which is unrealistic. Add a Uniform Random Timer with 200 ms constant + 100 ms random offset to simulate real user pacing. Avoid Constant Timer alone — it makes the load pattern too synchronized.
9. Recording with the HTTP(S) Test Script Recorder
Recording is the fastest way to bootstrap a test plan against a real application.
Step 1 — Add the recorder
Right-click Test Plan → Add → Non-Test Elements → HTTP(S) Test Script Recorder. Use port 8888.
Step 2 — Install the JMeter root certificate
Click Start. JMeter generates ApacheJMeterTemporaryRootCA.crt in the bin/ folder. Import it into your browser's trusted authorities.
Step 3 — Configure the browser proxy
Set HTTP proxy to 127.0.0.1:8888 on Firefox (it respects system proxy independently — easiest to set).
Step 4 — Walk through the user journey
Browse the app normally. JMeter captures every request under Recording Controller.
Step 5 — Clean up
Recorded scripts are noisy — remove static asset requests (CSS, JS, images), parameterize inputs, and add assertions. Correlate dynamic values (CSRF tokens, session IDs).
Modern alternative: For new projects, prefer the Chrome HAR export + JMeter HAR Import plugin over proxy recording — it captures the same traffic without proxy hassles.
10. Correlation and Parameterization
Correlation is the act of extracting a dynamic value from one response and feeding it into a later request. Without correlation, recorded scripts almost always fail on replay.
Extract a value with the JSON Extractor
Right-click the response sampler → Add → Post Processors → JSON Extractor:
- Names of created variables:
authToken - JSON Path expressions:
$.token - Match No.:
1 - Default Value:
NOT_FOUND
Use the token in the next sampler: ${authToken}.
Extract with the Regular Expression Extractor
For non-JSON responses, use regex. For a CSRF token hidden in HTML:
name="csrf_token" value="(.+?)"Parameterize with the CSV Data Set Config
username,password,card
alice,Sup3rSecret!,4111111111111111
bob,Sup3rSecret!,4222222222222222
carol,Sup3rSecret!,4333333333333333
Set Recycle on EOF to true and Stop thread on EOF to false. Reference as ${username}, ${password}, ${card}.
11. Logic Controllers
Transaction Controller
Wraps a sequence of samplers into a single result — used to measure end-to-end business transactions like "checkout" or "search and book."
If Controller
Runs its children only when a condition is true. Use ${JMeterThread.last_sample_ok} to retry only on failure.
Loop Controller
Loops its children N times. Combine with a CSV Data Set to drive data-driven flows.
ForEach Controller
Iterates over a list of variables extracted by a previous post-processor — perfect for batch operations.
Module Controller and Include Controller
Reuse a recorded controller in multiple places — the JMeter equivalent of a function library.
12. HTML Dashboard Reporting
The HTML dashboard is the deliverable that lands in your stakeholders' inbox. It has interactive charts for response time, throughput, errors, and active threads over time.
jmeter -n -t first-plan.jmx -l result.jtl -e -o report/Flags explained:
-n— non-GUI mode (required for accurate load).-t— test plan file.-l— raw results file (JTL).-e— generate the HTML report at the end.-o— output directory for the report (must be empty or non-existent).
The report includes APDEX (Application Performance Index), a statistics table (error %, 90/95/99% lines, throughput, bandwidth), response time over time, threads over time, bytes throughput, latency, connect time, response codes per second, per-sampler distribution, and top 5 errors by sampler.
13. Distributed Load Testing
A single JMeter load generator caps at around 1,000–2,000 concurrent threads depending on hardware. To simulate more, distribute the load across multiple machines.
Architecture
- Master — controls the test, aggregates results.
- Slave / Load Generator — executes threads and sends metrics back.
Step 1 — Start the slaves
# On each slave
jmeter-server
Step 2 — Configure the master
remote_hosts=10.0.0.21,10.0.0.22,10.0.0.23
client.rmi.localport=50000
Step 3 — Run distributed
jmeter -n -t first-plan.jmx -r -l result.jtl -e -o report/The -r flag tells JMeter to start the test on all remote hosts.
Caution: Make sure master and slaves are on the same network segment with low latency, use the same JMeter and Java versions, and have synchronized clocks (NTP).
14. JMeter in CI/CD
GitHub Actions example
name: JMeter Load Test
on: [pull_request]
jobs:
  load:
    runs-on: ubuntu-latest
    steps:
      - uses: actions/checkout@v4
      - uses: actions/setup-java@v4
        with:
          distribution: temurin
          java-version: '17'
      - name: Download JMeter
        run: |
          wget https://archive.apache.org/dist/jmeter/binaries/apache-jmeter-5.6.3.tgz
          tar -xzf apache-jmeter-5.6.3.tgz
      - name: Run JMeter
        run: |
          ./apache-jmeter-5.6.3/bin/jmeter -n \
            -t test-plans/smoke.jmx \
            -l result.jtl \
            -e -o report/
      - name: Publish HTML report
        uses: actions/upload-artifact@v4
        with:
          name: jmeter-report
          path: report/
Maven JMeter Plugin
<plugin>
  <groupId>com.lazerycode.jmeter</groupId>
  <artifactId>jmeter-maven-plugin</artifactId>
  <version>3.8.0</version>
  <executions>
    <execution>
      <id>jmeter-tests</id>
      <phase>verify</phase>
      <goals><goal>jmeter</goal></goals>
    </execution>
  </executions>
</plugin>
Performance gates: Fail the build when p95 > 800 ms or error % > 1.
15. JMeter Best Practices for 2026
Do
- Run in non-GUI mode for any real load.
- Use realistic ramp-up (1 thread per 100–500 ms).
- Parameterize everything — no hard-coded URLs, tokens, or users.
- Use Simple Data Writer or Backend Listener in CI; build the HTML dashboard from JTL.
- Add Duration Assertion as a quick SLA guard in CI.
- Version control your JMX files.
- Calibrate thread counts in a smoke test before pushing to production-like volume.
Don't
- Don't run heavy load from a laptop on Wi-Fi.
- Don't add View Results Tree to production-scale tests.
- Don't correlate in code — use the JSON Extractor or Boundary Extractor.
- Don't test in a different region than your real users.
- Don't trust a single run — repeat three times and take the median.
16. Choosing the Right Hardware for Load Testing
The machine you run JMeter on is the bottleneck — choose it deliberately. Here is a 2026 sizing guide.
| Target load | Recommended load generator | JMeter JVM settings | Notes |
|---|---|---|---|
| Up to 200 concurrent users | 2 vCPU, 4 GB RAM, 1 Gbps | -Xms512m -Xmx2g | A laptop will do |
| 200–1,000 users | 4 vCPU, 8 GB RAM, 1 Gbps | -Xms1g -Xmx4g | Dedicated VM recommended |
| 1,000–3,000 users | 8 vCPU, 16 GB RAM, 10 Gbps | -Xms2g -Xmx8g -XX:+UseG1GC | Use G1GC for low-pause GC |
| 3,000+ users | Distributed: master + 4–16 slaves | -Xms2g -Xmx8g -XX:+UseG1GC | Cloud or Kubernetes |
Latency matters more than bandwidth
A load generator co-located in the same AWS region as your app will give dramatically different results than one running from across the public internet. For accurate production-load simulation, place the generator in the same region and same VPC.
Always exclude the load generator from monitoring
Your monitoring should separate load-generator metrics from app metrics. Otherwise you'll see "the app is slow" when in reality your JMeter machine is the bottleneck.
17. Common JMeter Errors and How to Fix Them
1. Non HTTP response code: SocketTimeoutException
Cause: Your target app is slower than the timeout, or the load generator is exhausted. Fix: Increase connect/response timeouts in the HTTP Request defaults. Verify the app is healthy with a single-user smoke test.
2. OutOfMemoryError: Java heap space
Cause: View Results Tree on a heavy test, or unbounded JTL. Fix: Use Simple Data Writer. Add -Xmx8g. Stream JTL to a Backend Listener.
3. Connection refused
Cause: Wrong port/host or firewall blocking. Fix: Verify with curl from the same machine. Check security groups.
4. JMeter variables cannot be resolved: ${authToken}
Cause: Extractor didn't capture the value. Fix: Add a Debug Sampler to inspect variables. Verify the JSON path against the actual response.
5. OutOfMemoryError: GC overhead limit exceeded
Cause: Too many threads on a single machine. Fix: Reduce thread count per generator and distribute. Switch to ZGC on Java 21.
6. Address already in use: bind
Cause: RMI port collision in distributed mode. Fix: Set client.rmi.localport=50000 and server.rmi.localport=50001 consistently. Open the port in firewalls.
7. The target server failed to respond
Cause: Server returned an HTML 500 error page. Fix: Add a Response Assertion that checks for 200. Capture the HTML error page to a JTL for debugging.
Continue your performance testing journey
- JMeter Interview Questions (Experienced)
- Performance Testing Interview Q&A (JMeter, k6, LoadRunner)
- Software Testing Interview Questions (Master List)
- Cypress Testing Tutorial
Pair this guide with the AI Mock Interview and Resume ATS Review. Live salary numbers for performance engineers in /salaries.
Frequently asked questions
Is JMeter still relevant in 2026?
Yes — it is the most widely deployed open-source load testing tool, with active releases and a rich plugin ecosystem.
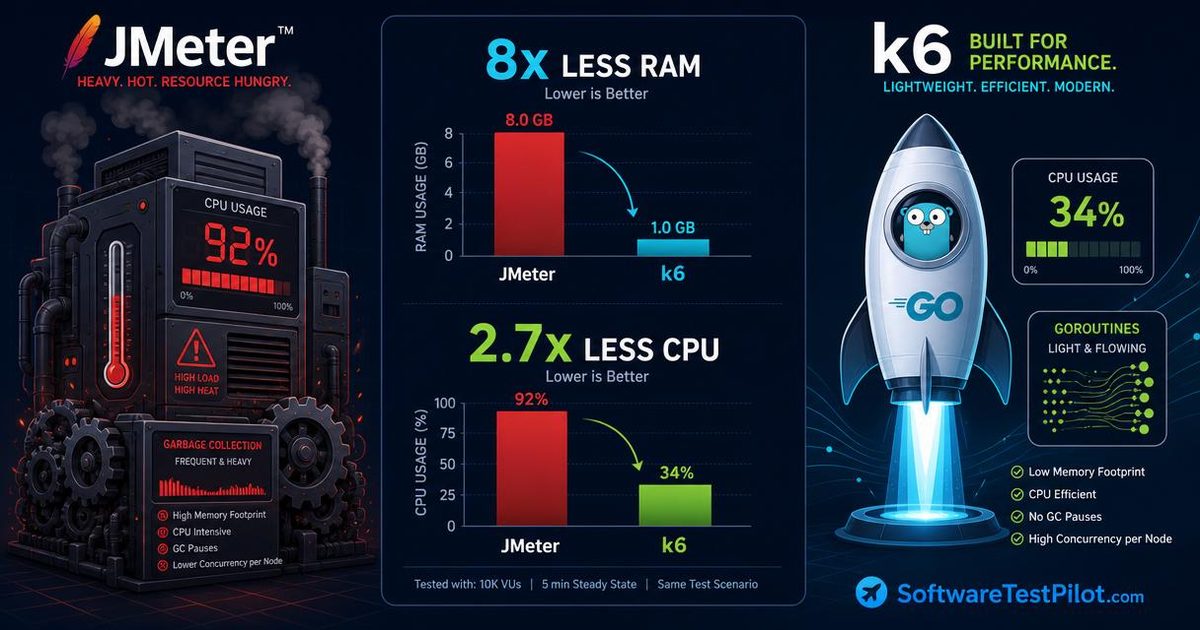
JMeter vs Gatling vs k6 — which should I learn first?
For a beginner, JMeter is the easiest entry point thanks to its GUI. For code-first CI/CD workflows, k6 (JavaScript) is the most modern. For protocol breadth, JMeter is unmatched.
Can JMeter simulate real browser behavior?
No — JMeter is protocol-level. For pixel-level browser load, use Playwright, k6 Browser, or Selenium Grid with realistic network shaping.
How many concurrent users can one JMeter instance simulate?
On modern hardware (4 cores, 16 GB RAM) you can comfortably run 1,000–2,000 threads for HTTP. JDBC or JMS samplers are heavier. For higher volume, distribute across slaves or move to k6 on Kubernetes.
What's the difference between a Thread Group and a Transaction Controller?
A Thread Group simulates users. A Transaction Controller wraps multiple samplers into one logical business transaction so that the HTML dashboard reports it as a single row.
Where can I practice?
Use the public JSONPlaceholder and ReqRes APIs. For UI load, run your own dev environment with Docker Compose.
Practice these questions
Run a live QA mock interview tailored to this topic and get per-skill scoring in minutes.
Was this article helpful?
Keep building your QA edge
Pillar guides- AI Mock Interviewpractice these questions with our AI mock interviewLive AI-powered mock interviews with rubric feedback.
- ATS Resume ReviewSoftwareTestPilot's ATS resume checkerFree AI ATS scoring with rewrite suggestions.
- QA Jobs RadarSoftwareTestPilot's QA jobs boardLive QA / SDET / automation job feed, refreshed daily.
Continue reading

Join the QA Community
Connect with fellow testers, share job leads, and get career advice.
Stop Reinventing the Wheel. Upgrade Your QA Arsenal.
Take your testing skills from beginner to Lead Engineer. Supercharge your daily workflow with our premium digital resources.
- ⚡ Ready-to-use testing strategy templates
- 🔥 Advanced API & UI automation guides
- ⏱️ Save 10+ hours a week on test planning