
AI Performance Testing in 2026: LLM-Driven k6/JMeter/Gatling, Anomaly Detection & FAQ
The 2026 guide to AI performance testing — how to use LLMs to design load scenarios, generate k6/JMeter/Gatling scripts, analyse results, detect anomalies and pinpoint bottlenecks. RCTF prompts, rubric, PAA FAQs.

Last updated: July 15, 2026 · 14 min read · By SoftwareTestPilot
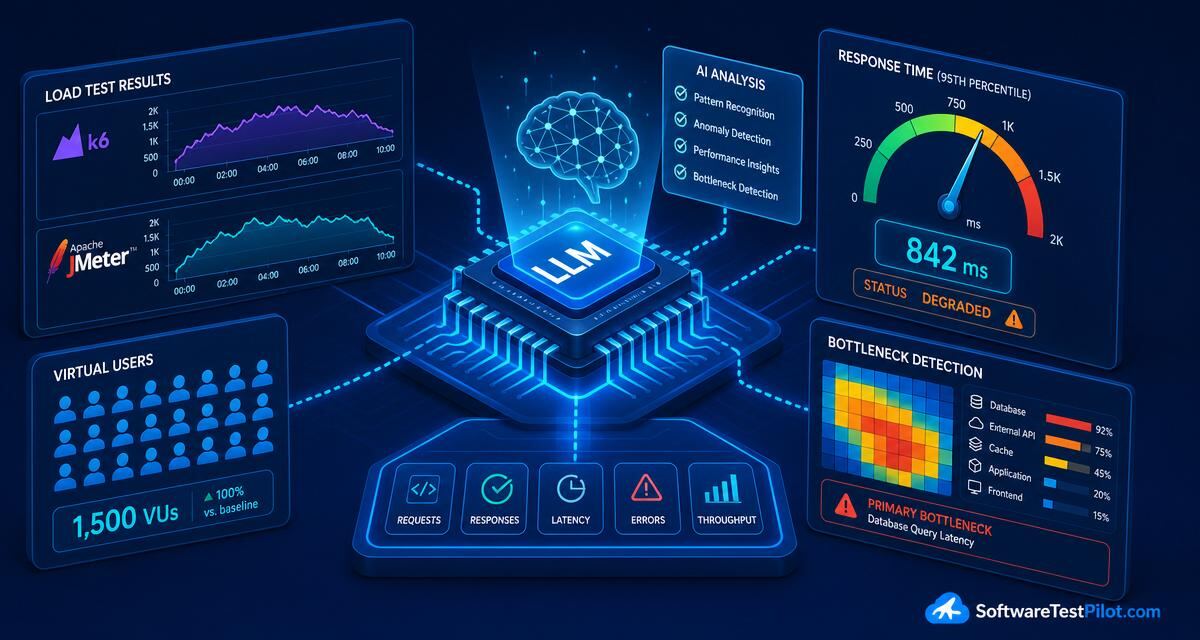
AI performance testing is using LLMs and ML anomaly detectors across the whole perf lifecycle: designing realistic load models, generating k6 / JMeter / Gatling scripts from an OpenAPI spec, running the tests in CI, and — the hardest part — interpreting the results, finding anomalies and pinpointing bottlenecks in a service map. In 2026 the shift is from "load test in a lab once per release" to "continuous perf regression on every merge, triaged by an LLM."
Consolidates "AI performance testing", "LLM load testing", "AI k6 generator" and "AI bottleneck detection". Pair with generative AI API testing and LLM for QA testing.
Key takeaways
- AI helps at 4 points: load model design, script generation, anomaly detection, root-cause hypothesis.
- Realistic load = distribution from prod traces, not a flat RPS.
- Ground every LLM analysis in real metrics — never let it "guess" a bottleneck.
- Compare runs statistically (p95 shift ≥ 10% + p ≤ 0.01) — not eyeball.
- Never run AI-generated load against production without a stage rehearsal.
1. Where AI fits in the perf lifecycle
- Load model design — LLM converts a prod trace summary into a k6/JMeter shape (ramps, plateaus, spikes, think-times).
- Script generation — LLM emits the runnable script (k6 JS, JMeter JMX/DSL, Gatling Scala/Java).
- Run — human/CI. AI does not run the load.
- Anomaly detection — ML model flags p95/error/throughput anomalies vs baseline.
- Root-cause hypothesis — LLM correlates anomaly window with deploys, DB metrics, GC pauses, upstream latency.
2. RCTF framework
- Role — "You are a senior SDET / ISTQB-Advanced test analyst. Prioritise risk coverage, boundary values and clarity for a QA lead reviewer."
- Context — paste the requirement, user story, OpenAPI spec, page object or stack trace, plus framework + version and the compliance regime (SOC 2, HIPAA, GDPR, EU AI Act) and coverage target.
- Task — one specific artefact: "Generate 15 test cases", "Draft an IEEE 829 test plan section 4", "Write a Playwright E2E for AC-14 with an @axe accessibility check".
- Format — the exact output shape: markdown table, JSON schema, Gherkin, Vitest .test.ts. End with a rubric self-critique.
3. Prompts (k6, JMeter, Gatling, analysis)
P1 — k6 script from OpenAPI
Role: performance engineer, k6 expert.
Context: [paste OpenAPI + top-10 endpoints by prod traffic %].
Task: k6 script — arrival-rate scenario, 500 iterations/s for 5 min, 90/10
read/write mix, weighted by traffic %. Assert p95 < 800ms, error < 0.1%.
Format: single .js file. Use httpx-like naming, thresholds block, tags.
P2 — JMeter DSL
Role: JMeter expert, Java DSL 5.
Context: [3 endpoints + auth flow].
Task: TestPlan with ThreadGroup 200 users, ramp 60s, hold 5min, CSV data set,
listeners = InfluxDB backend.
Format: single .java runnable class.
P3 — Anomaly triage from a run
Role: SRE + performance analyst.
Context: [paste last 5 baseline p50/p95/error/throughput + this run's numbers].
Task: flag statistically significant regressions (delta ≥ 10%, p ≤ 0.01).
For each, list the 3 most likely causes (deploy diff, DB, upstream, cache).
Format: markdown table + short verdict.
P4-P6 (short)
- Load model from prod trace — histogram + RPS shape → k6 stages.
- Bottleneck hypothesis — from APM span data + slow-query log.
- Capacity plan — from a run at 60% CPU, project safe RPS ceiling.
4. AI-augmented performance tools
| Tool | Best for |
|---|---|
| k6 Cloud / Grafana Cloud k6 | Cloud runs, thresholds, AI insights |
| Datadog Watchdog / Bits AI | Anomaly detection + root-cause narration |
| New Relic AI | APM anomaly + regression detection |
| Dynatrace Davis AI | Causal AI on service maps |
| BlazeMeter + AI Test Suggestions | Load test scaffolding |
5. Performance test review rubric
- Realistic load — shape and mix match production, not flat RPS.
- Baseline — every run compared to the last 5 baselines statistically.
- SLOs — thresholds (p95, error, throughput) codified in the script.
- Isolation — no shared env with dev/CI; warm caches consistently.
- Observability — APM + logs + slow queries captured for every run.
- Reproducibility — script + data + env pinned in Git.
- Human in the loop — AI proposes, human decides go/no-go.
6. Governance
Any AI workflow that touches product data or code must run under governance:
- Enterprise LLM APIs with a no-training / zero-retention clause. Never a free consumer chat for customer data.
- Redact PII, PANs, JWTs, HARs, secrets and production URLs before any prompt.
- Version prompts in a Git-tracked QA prompt library. Every AI-generated artefact ships with an "AI attribution" line and a human SDET sign-off.
- Map controls to the NIST AI RMF and, for EU products, the EU AI Act.