The Ideal Dev to QA Ratio: Benchmarks for 2026 Engineering Teams
What is the right dev to QA ratio in 2026? Benchmarks by company stage (startup, scale-up, enterprise), industry data, formulas to calculate your target ratio, and how modern shift-left + AI testing changes the math. For engineering managers and QA leads.

Last updated: July 17, 2026 · 13 min read · By Avinash K
Every engineering leader eventually asks the same uncomfortable question: how many QA engineers do I actually need per developer? Post the query in any CTO Slack group and you will get 10 conflicting numbers within an hour — 1:1, 1:5, 1:10, or the fashionable “we don’t hire QA at all”. The reality in 2026 is more nuanced than any single ratio, but it is not a guessing game either. Company stage, deployment cadence, regulatory risk, and how much shift-left tooling your developers actually use will pin the number down to a defensible range.
This guide translates 15 years of published industry data plus 2026 benchmarks from live requisitions on the QA Jobs Radar into practical dev to QA ratio targets you can present to a VP of Engineering or board. If you are a QA lead who suspects your team is dangerously understaffed, or a founder trying to work out whether hiring your first tester is premature, the tables below will settle the debate.
Key takeaways
- The old “1 QA per 3 devs” rule is dead — 2026 benchmarks span 1:3 (regulated) to 1:15 (mature SaaS).
- Ratio is a lagging indicator. What actually drives quality: automation coverage, deploy frequency, and shift-left culture.
- Startups under 12 engineers rarely need a dedicated tester if devs own PR-level Playwright + API tests.
- Enterprise fintech, healthtech, and aviation still legitimately staff 1:3 to 1:5 because failure cost is regulatory.
- AI copilots (Copilot, Claude, Cursor) have shifted median SaaS ratios from ~1:6 in 2019 to ~1:10 in 2026.
1. Why the dev to QA ratio still matters (and where it misleads)
The dev to QA ratio is the number of application developers on a team divided by the number of dedicated quality engineers — SDETs, automation engineers, and manual testers combined. A team of 20 developers and 4 QA engineers runs at a 5:1 ratio. Simple arithmetic, but it is the single most-cited metric in engineering staffing conversations because it maps directly to headcount budget.
Where the ratio genuinely matters:
- Headcount planning. Finance wants a defensible model. “We staff 1 SDET per 7 devs, benchmarked against Stripe and Datadog” ends the argument.
- Escape-defect triangulation. When production incidents spike, comparing your ratio against industry benchmarks reveals whether the problem is staffing or process.
- Interview loops. Senior QA candidates ask for your ratio in the first screen — it signals investment in quality without you having to say it.
Where it misleads:
- It ignores automation leverage — 2 SDETs with a mature Playwright + GitHub Actions harness out-cover 8 manual testers on spreadsheets.
- It ignores developer testing culture — a team where every dev writes unit + integration tests needs half the dedicated QA of a team that throws code over the wall. Reinforce this with the CI/CD mastery guide.
- It ignores domain risk — a payments API and a marketing microsite are not the same product, even at identical ratios.
2. 2026 industry benchmarks by company stage
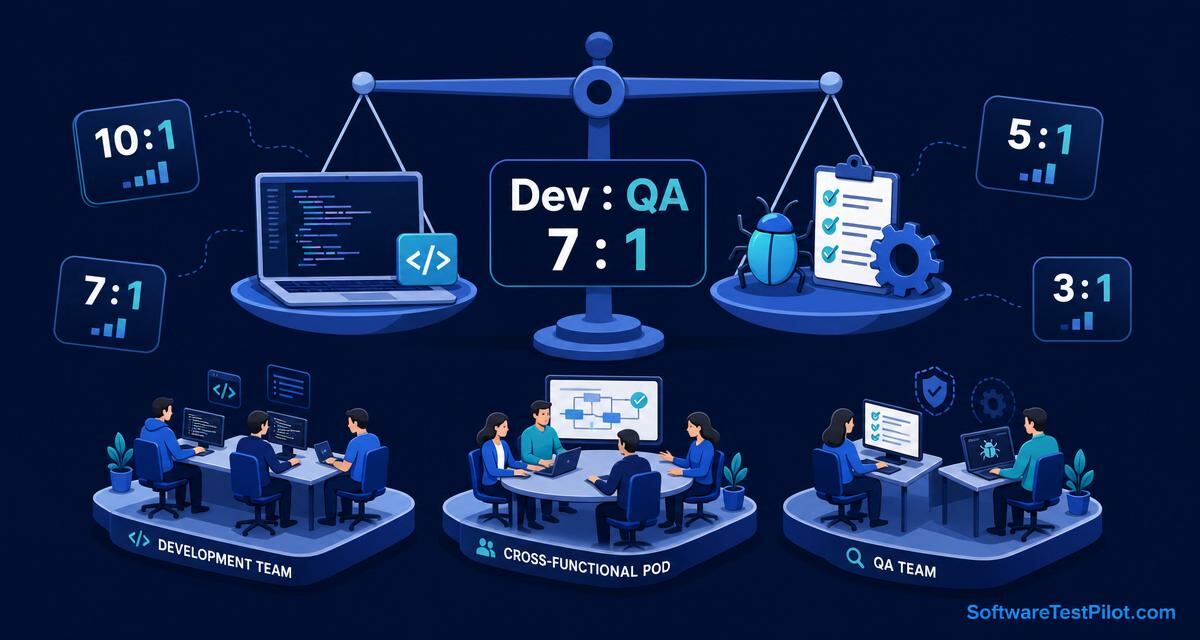
The table below aggregates public engineering blog posts, LinkedIn org charts, and live 2026 job-req volume from the QA Jobs Radar. Read it as the defensible range for a healthy team, not a single number.
| Company stage | Typical eng team size | Recommended dev : QA | QA composition | Deploy cadence |
|---|---|---|---|---|
| Pre-seed / seed startup | 1 – 8 devs | N/A (devs own quality) | 0 dedicated QA. Founders + devs run PR checks. | On demand |
| Series A startup | 8 – 20 devs | 10:1 to 15:1 | 1 senior SDET who builds the Playwright + CI harness. | Daily |
| Series B / scale-up | 20 – 80 devs | 7:1 to 10:1 | Mix of SDETs (60%), automation eng (30%), 1 manual explorer. | Multiple / day |
| Growth-stage SaaS | 80 – 300 devs | 6:1 to 8:1 | Platform QA team + embedded SDETs per pod. | Continuous |
| Public SaaS / cloud enterprise | 300 – 3,000 devs | 5:1 to 8:1 | Central Quality Engineering org + pod-embedded SDETs. | Continuous with feature flags |
| Regulated (fintech, healthtech) | Any | 3:1 to 5:1 | SDETs + compliance testers + accessibility specialists. | Weekly / gated |
| Aviation, medical devices, defence | Any | 1:1 to 3:1 | Formal V&V engineers, safety-case reviewers. | Quarterly / release trains |
Notice the pattern: as failure cost rises, the ratio tightens. A payments outage burns real money; a marketing site A/B test does not. Set your ratio to match your blast radius, not your competitor’s.
3. A defensible formula for your target ratio
If you need to justify a number to your CFO, use this simple weighted formula rather than a single benchmark:
Target QA headcount = (Dev headcount) / R

where R = base_ratio × automation_multiplier × risk_multiplier

base_ratio          = 8   (2026 SaaS median)
automation_multiplier = 0.8 to 1.4
  (0.8 = weak dev testing culture, needs more QA)
  (1.0 = decent unit + integration coverage)
  (1.4 = strong shift-left + AI-assisted PR tests)
risk_multiplier     = 0.4 to 1.2
  (0.4 = aviation / medical / payments core)
  (0.7 = fintech / healthtech app layer)
  (1.0 = general B2B SaaS)
  (1.2 = internal tools, low blast radius)
Example: a 60-dev fintech scale-up with reasonable unit-test coverage lands at R = 8 × 1.0 × 0.7 = 5.6, so target QA headcount is 60 / 5.6 ≈ 11 QA engineers. That is a defensible board-deck number.
Whenever you brief a CTO on the output, pair it with a concrete role split (SDETs, automation eng, manual explorers) and a hiring timeline. Practise the executive framing out loud with the AI Mock Interview — the same technique that unlocks Staff-level offers on the Big Tech SDET loop.
4. Why shift-left and AI copilots widened the ratio
In 2015, the median SaaS engineering org ran roughly 1 QA per 5 devs. In 2026 that median is closer to 1 per 10. Three structural shifts explain the change:
- Developers now own unit + integration testing. A modern Series B eng org expects every PR to ship with unit tests, contract tests, and often a Playwright smoke — see the CI/CD mastery guide.
- AI copilots write the boilerplate. Tools like GitHub Copilot, Cursor, and Claude generate 30–60% of Playwright and API test scaffolding. See our GitHub Copilot for QA testing guide.
- SDETs replaced manual testers 2:1. One SDET who owns a sharded CI harness covers the regression surface of 3–4 manual testers from the 2015 era. Compare career bands in the SDET vs QA salary gap.
None of this means quality has become optional — it means the QA role has moved upstream. If your team is still measuring itself by manual regression pass-rate, your ratio will feel painfully thin. Move the metric to escape-defect rate and lead time for changes, and 1:10 stops feeling scary.
5. Warning signs your ratio is wrong
Ratios drift silently. Watch for these five signals that your dev-to-QA number no longer fits reality:
- Escape-defect rate climbing 2 quarters in a row. Bugs your team missed reaching production. Either QA is understaffed or automation coverage is thin.
- Regression suite runs longer than 20 minutes. Signals under-invested test infra — see the CI flake-fix playbook.
- QA becomes the release bottleneck. If sprint demos wait on manual sign-off, you either need more testers or more automation. Usually the latter.
- Developers stop writing tests. A cultural failure — throwing more QA at it will only mask the problem. Fix the culture first.
- Attrition on the QA team. Under-staffed QA teams burn out fastest. Read the real reason manual testers get stuck.
If two or more of these are true, revisit the formula in section 3 with fresh multipliers. Do not simply hire more manual testers — invest in an SDET who can lift automation coverage and unblock the pipeline.
6. Which QA role to hire in what order
Once the formula says you need more QA capacity, the sequence of hires matters more than the raw headcount. Here is the order that consistently pays off in 2026:
- Hire #1 (Series A, 8–15 devs): Senior SDET. Builds the Playwright + GitHub Actions harness, defines PR quality gates, sets the testing culture. Not a manual tester.
- Hire #2 (Series A/B, 15–30 devs): Automation engineer. Extends coverage into API and integration layers. Owns the flake budget.
- Hire #3 (Series B, 30–50 devs): Embedded SDETs per pod. One SDET per 5–8 devs, embedded in the product squad — not centralised.
- Hire #4 (Series B+, 50+ devs): Performance / accessibility / security specialist. Depending on domain — pick the highest-risk non-functional axis first.
- Hire #5 (Growth/Enterprise): Quality architect / Staff SDET. Cross-pod governance, tooling standards, hiring bar. See the 5-stage QA career roadmap.
Skip a stage at your peril. Hiring a Quality Architect when you don’t yet have a functioning CI harness is a common Series C mistake — the architect quits after 6 months because there is no leverage to multiply.
7. Your 24-hour action step
Open a scratchpad and run the section-3 formula against your current team. Compare the output to your actual QA headcount. If the delta is greater than ±30%, you have a staffing case to open with your VP of Engineering this week — either to hire, or to reallocate manual testers into SDET training.
Whether you are the QA lead building the case, or an SDET aiming for the Staff-level role that owns this conversation, level up with the QA engineer roadmap, sharpen technical depth with the Playwright interview questions and API testing Q&A hub, benchmark your comp on the QA Salary Guide, and audit your resume through the ATS Resume Reviewer. For authoritative external reading, pair this article with the Google DORA research — the four DORA metrics correlate far more strongly with engineering performance than any dev-to-QA ratio.